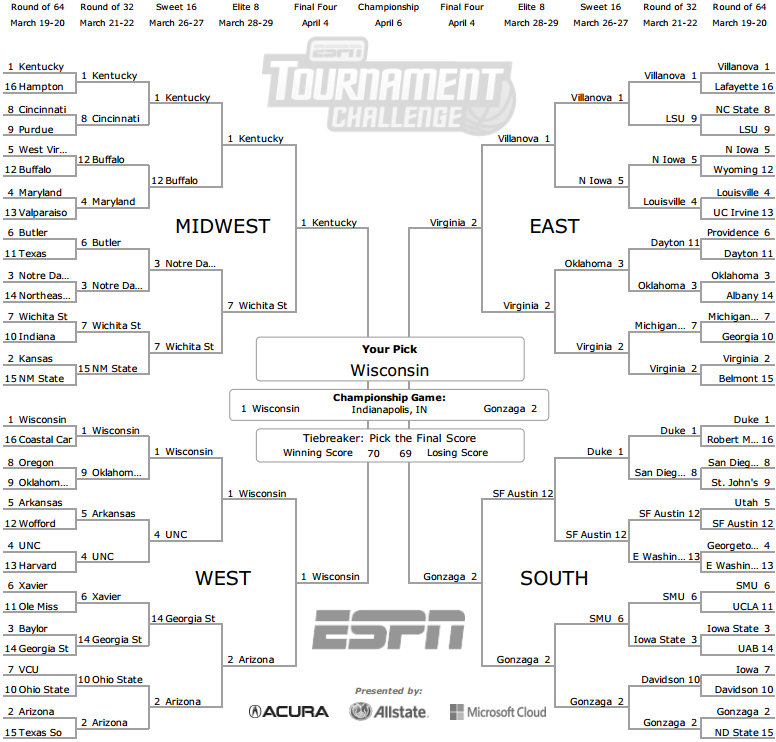
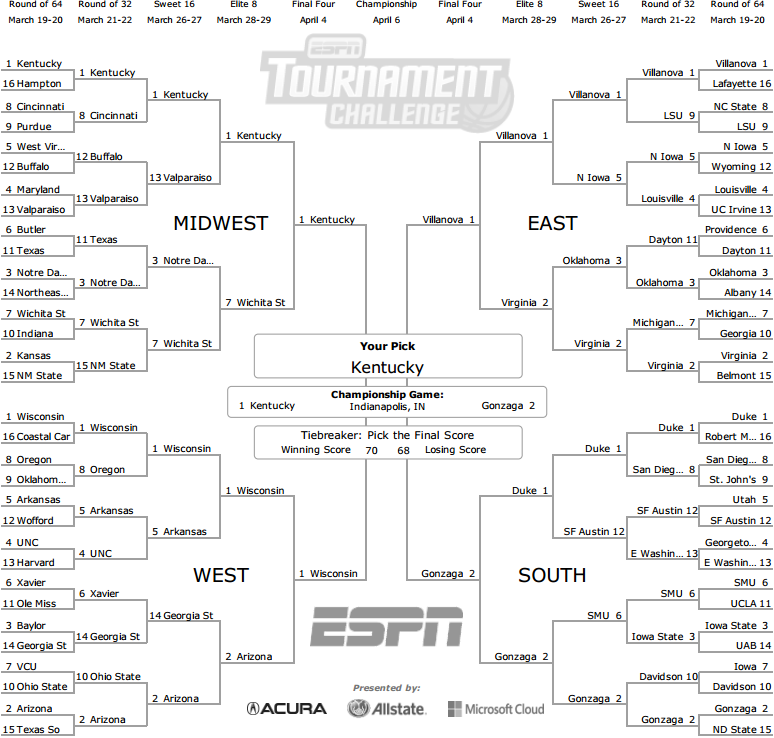
Update - Well, Wisconsin came close but couldn’t quite pull it off. At least the prediction around them knocking out Kentucky worked out, and I’m pretty happy with that. I’ll definitely be predicting regular season games next year along with the tournament, and with a whole year to improve the models, I’m hopeful next year will be even better!
The Madness is finally here! After reading about the NCAA Kaggle competitions the last few years I was really excited to have the time to develop my own predictive models for NCAA basketball. I started back in late January in order to give myself enough time, and not surprisingly, I needed quite a bit of it.
The web scrapers (for game data / upcoming schedules, etc.) were built using the Scrapy library in Python, and back-end storage was handled by MySQL. Predictions were all done in R (though I did experiment a bit with scki-kit learn for this purpose) running on a headless Linux VM. For those of you who may be unaware (as I was), you can set Rscript as your script interpreter via shebang and pretty much execute any R script from the shell just like you would a plain-old shell script!
Initially the challenge of predicting a winner for a given NCAA basketball game struck me as a classification problem, so I spent a good week building a model focusing on classifying a winner from two given teams (in my case, the away team). In my opinion, this was ultimately the wrong strategy, but I’m really glad I went down that road as the ability to use classification-based ML methods (especially tree-based ones) was very useful in understanding the relative importance of certain variables on a game’s outcome.
After I finished the first classification model I quickly realized that I couldn’t just stick with one ML method as I was too interested in how different methods come to their decisions (what if RandomForest is better than C5.0?!). I may have overdone it a bit, but in the end I wound up with 9 different classification models (utilizing various combinations of variables and ML methods) all voting individually on a winner. Thankfully it was automated and the results were emailed to me each morning, so the pen-and-paper workload was minimized. I was really pleased with how this was working out, until it struck me that perhaps it would be more useful if I could predict actual game scores than simply the outcome of the game as a binary result.
I started doing some research on that, and ended up posting on Reddit’s ML sub-reddit, where thankfully Scott Turner chimed in to share a bit of his wisdom. Scott has been making NCAA BB predictions for years and was a wealth of information (not to mention extremely patient with some of my more basic questions). He also posts about a 100 times more frequently than I do, so if ML and basketball is something you’re interested in, definitely make it a point to read his website.
After many discussions with Scott and a lot of research on my own, I realized predicting the score differential (and ultimately using the cumulative distribution function to translate the differential into probabilities) was the way to go. Unfortunately, that meant re-working the scrapers, the MySQL database and all of the R prediction code. It took a good week and a half, but I managed to get it done and ended up with a number of different regression prototypes.
I used a combination of RMSE, modified index of agreement (Willmmott, 1981) (Legates and McCabe, 1999), and outcome correctness to evaluate the model performance (after all, predicting a score differential of 1 is fantastic if the final score is 59-60, but if you chose the wrong team to win by 1, you still chose the wrong team). After a number of optimization rounds, I ended up with 4 different regression models that I was happy with.
Side Note For those of you who are interested in doing something similar, let me save you some time. From my experience, linear regression works better than most, if not all, machine learning algorithms.. and I tried everything from SVM / neural nets / regression trees / gradient boosting, etc…
As far as translating regular season performance to predicting tournament games, the only real variation I made was to include tournament games into my test/training data sets (I had excluded them for the regular season predictions). Scott has written a great post about randomness and tournaments, and I think there’s a lot of work that can still be done to improve the models for tournament specific scenarios (travel distance, possible incorporation of seeds / weighting, neutral courts or semi-neutral courts (being in your home state, but not necessarily your home court), average team away attendance, etc..) but for now I left good enough alone and used the basic regular season models with the additional tournament data. Next year I hope to dig much deeper into tournament-specific variables.
Below are filled out brackets for each of the 4 regression models (I found it much easier to do this by initially predicting the outcome of all combination of games for all 68 teams and then looking up the results for a given match-up, rather than doing it round by round).
I was really surprised at how consistently the models converged by the Elite Eight round, and all but one model (Model C) ended up choosing Kentucky as the champion. I do want to mention that at no point do I utilize NCAA tournament seeding as a variable, so it’s pretty interesting to track how the tournament seeds progress in the various models.
Ultimately I chose Model C as my ‘champion’ model to submit to the Machine Madness tournament (a pick-em for solely ML entries) because I felt the others were too boring. It may turn out that boring is actually more correct, in which case I’ll look silly, but it’s all for fun anyway.
Model A
Straight linear regression including every variable I have (~220 variables in total).
Final Four - Kentucky, Wisconsin, Villanova, Gonzaga
Champion - Kentucky
Model B
Using backwards feature selection to reduce dimensionality, I ended up with ~100 variables, and combined two SVM models (a linear SVM as well as an SVM with a radial-basis kernel function) and a single linear regression model.
Final Four - Kentucky, Wisconsin, Villanova, Gonzaga
Champion - Kentucky
Model C
This is my wild card model.. PCA for initial dimensionality reduction, and completely tree-based with plenty of bagging involved. Decision trees and regression don’t necessarily go hand in hand, but the variation in results from the other models makes this one interesting to me.
Final Four - Kentucky, Wisconsin, Virginia, Gonzaga
Champion - Wisconsin
Model CB
A weighted combination of Models B & C.
Final Four - Kentucky, Wisconsin, Villanova, Gonzaga
Champion - Kentucky


